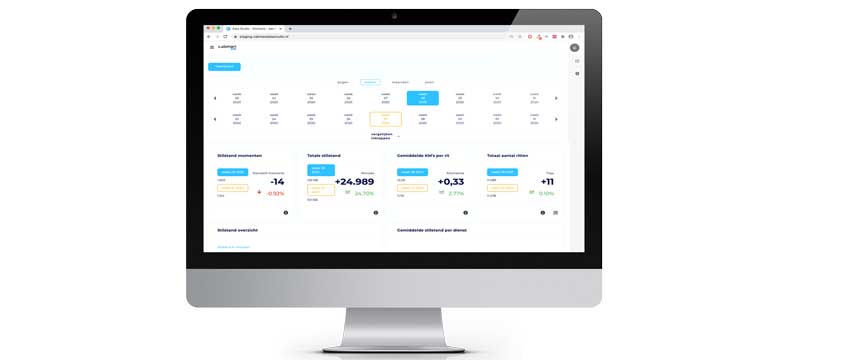
With Data Studio, Cabman has developed an application for translating raw data into relevant insights for taxi companies. These insights include numbers of journeys, stoppages and the average distance per journey. These and other data can also be compared per period of time.
Data Studio works with a number of critical performance indicators. All these KPIs and the associated data can be seen on a dashboard. This concerns the KPIs: total standstill, the number of loaded trips, the service overview, the average standstill, the total number of trips, the average number of kilometres per trip, the activity distribution and services with an invalid break. Information about the loaded trip ratio per driver and total will be added shortly.
All these data can be compared on a monthly or quarterly basis, so that the taxi company can gain insight into the developments of the various KPIs and make adjustments accordingly if required. The differences are shown in percentages as well as in total numbers.
Problem solved
Data Studio is part of Cabman Data, in which it is possible to download reports in Excel. “However, we were told by several users that it was difficult to select the right columns each time in Excel. To solve this problem, we have made sure that in Data Studio you can choose which existing columns you want to see. As a user you no longer have to do this yourself in Excel. You can then easily filter your own report in Data Studio and download your filtered report into Excel.
Lees de Nederlandse vertaling op TaxiPro.
