It is now possible to view the Cabman Driving behavior Analysis scores via Cabman Data Studio. This makes it even easier to view the Cabman Driving behavior Analysis scores.
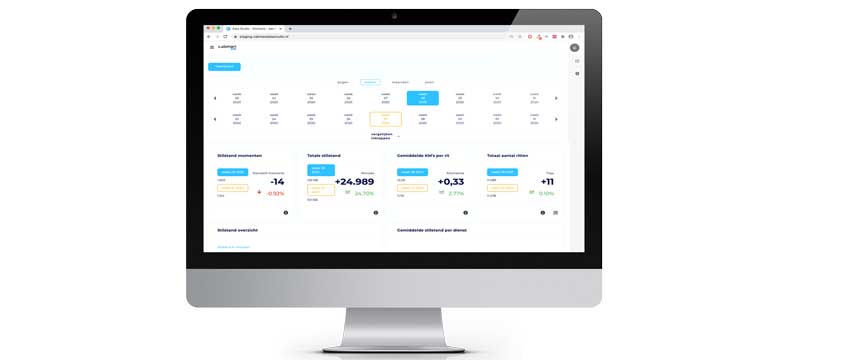
Cabman Driving behavior analysis for the Cabman BCT gives you insight into the driving behaviour of your drivers. All data is collected by the BCT and fed back to Data Studio. In Data Studio, you can then find the information processed in a special scoreboard (as shown below). This allows you to see at a glance which driver is performing best and which less well.
 Making the driver more aware
To ensure that the driver also gains insight into his or her driving behaviour, the BCT also provides information during and after the shift about the scores of the Driving behavior Analysis. In this way, the BCT makes the driver aware of possible bad driving behaviour.
How are the scores determined?
The scores are determined on the basis of the national average. These averages are adjusted continuously and give an idea of how your drivers drive compared to the national average.
Electric vehicles
In addition to driving behaviour, you can also view data about the battery percentage of electric cars. This is made possible by the addition of a CAN interface. In style with the Cabman Driving behavior Analysis, this also generates a rating for the development of the battery percentage.
Want to know more?
Would you like to know more about Cabman Driving Style Analysis? Then get in touch with us. You can do so by sending an email to info@cabman.eu . We’ll be happy to tell you more about the possibilities.